This edition of the Housing Stability Monitor will explore data through June 2023.
Posted on September 6, 2023
By Matija Jankovic at MHP’s Center for Housing Data
Over the last three years, MHP’s Center for Housing Data has been researching and reporting on the state of housing stability in Massachusetts. Amid fluctuating unemployment rates, wavering legal protections, changes to crucial support systems, and ever-growing rents and home sale prices, trends in eviction and foreclosure rates in the Commonwealth deserve regular attention.
During the pandemic, MHP established an internal Eviction and Foreclosure Task Force, which brought together staff from across our organization to compile data on eviction and foreclosure rates, discuss changes to key policies and supportive programs, and brainstorm opportunities to better support renters and homeowners across the state. While some data trends appeared to stabilize following the end of the Federal Eviction Moratorium, more recent developments in eviction filing rates and foreclosure petitions have reignited our motivation to explore this data further. We are committed to making this critical data public and will continue to update our reporting efforts on a quarterly basis.
This is the first edition of our Eviction & Foreclosure Monitor – We encourage you to explore the latest trends in eviction and foreclosure data for yourself and share how your community has been affected.
EVICTION TRENDS
Key Takeaways:
- Eviction filing rates have increased significantly from June 2022 to June 2023
- 11 out of the last 12 months have surpassed pre-pandemic rates of eviction filings (600 total filings per week, 2600 total filings per month).
- December 2022 saw the highest number of eviction filings since the beginning of the pandemic with over 4,000 filings in a single month.
- From July ‘21 – June ‘22, non-payment evictions were filed at a rate of 1160 per month while from July ‘22 – June ‘23, non-payment evictions were filed at a rate of 2160 per month. Over this period, eviction filing rates for non-payment have increased by 86 percent.
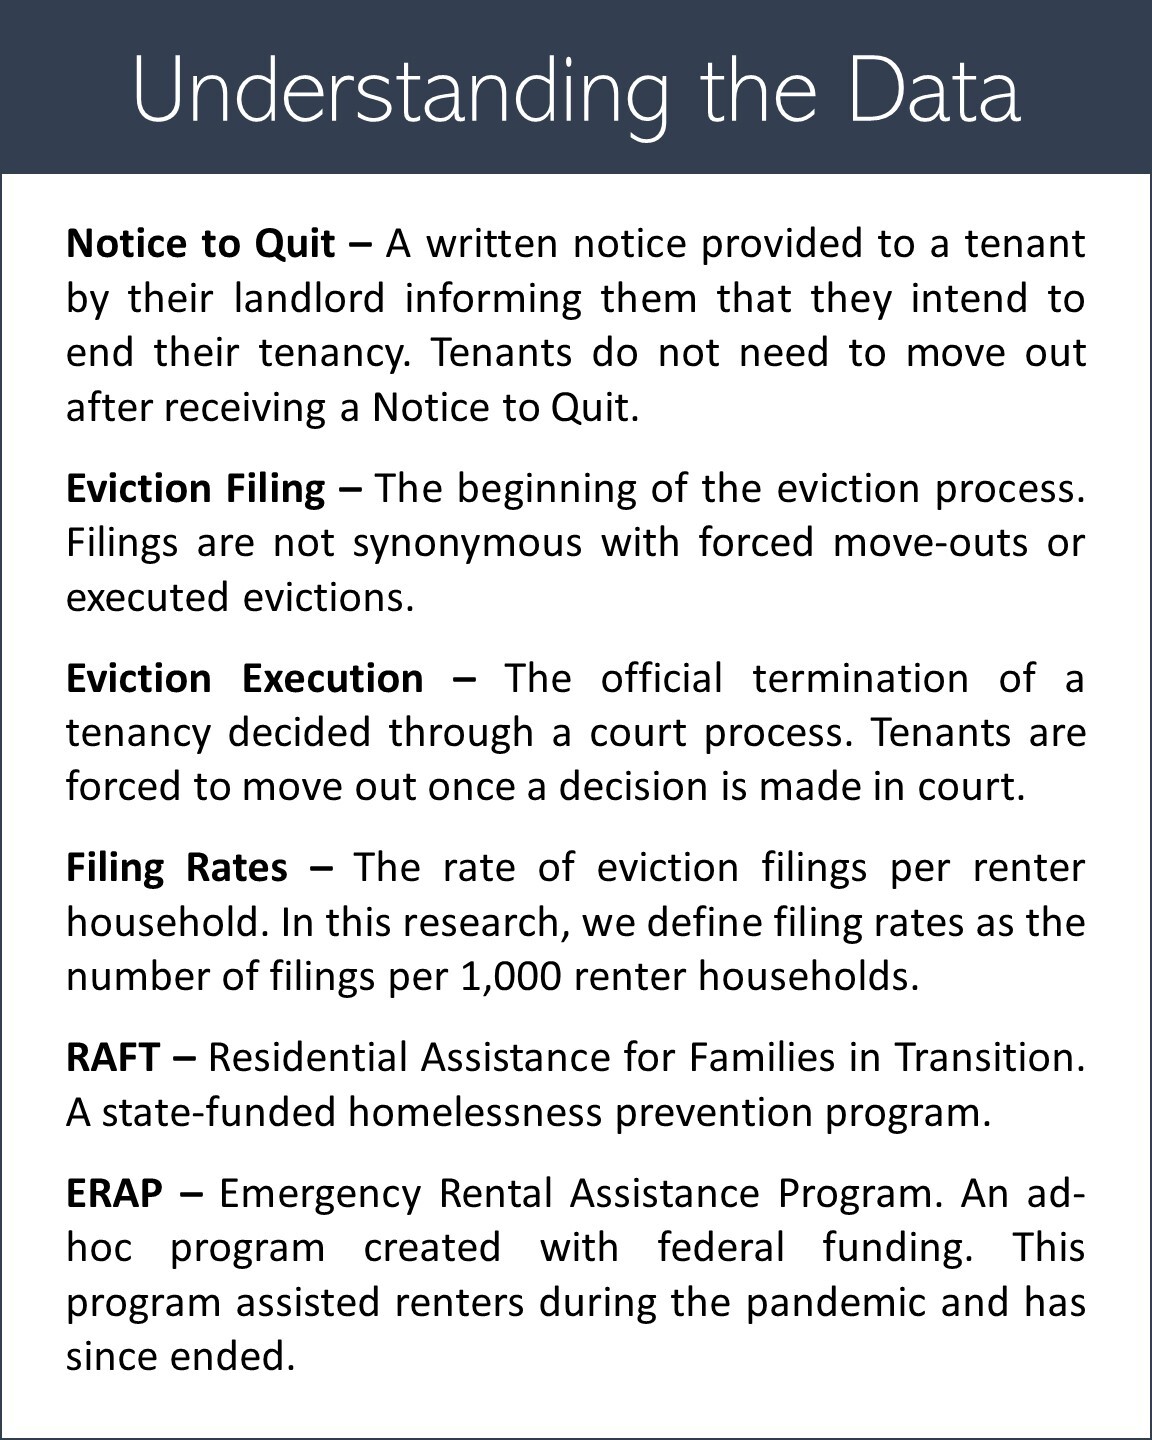
- Changes to the Residential Assistance for Families in Transition (RAFT) application in August 2022 required applicants to submit a Notice to Quit (NTQ) to apply for rental assistance, which appears linked to the increase in non-payment eviction filings.
Additional Context:
We observed the impact of the pandemic on eviction filing rates in late 2020, prior to the enactment of the federal moratorium on evictions and foreclosures. The concerted effort between federal and state-led support systems distributed over $1 billion in rental assistance to tenants who were temporarily protected from being evicted, in an effort to mitigate the impacts of the COVID recession on renters in Massachusetts.
In the aftermath of the COVID emergency, marked by the August 2021 decision to suspend the federal Eviction Moratorium, rates of eviction filings remained relatively stable. While these filing rates appeared to slowly increase, they remained relatively low compared to pre-pandemic eviction filing numbers. Research conducted by our team points to the major impact that rent relief programs had on suppressing eviction filing rates, which continued to support tenants struggling to pay their rent.
While effective, these programs were not a permanent solution to the state’s housing crisis. Federal and state funding for programs to mitigate the impact of the COVID emergency was spent down and many key programs ended, such as the Emergency Rental Assistance Program (ERAP), which distributed $668 million to 67,293 households in Massachusetts since its inception. Applications were diverted to the RAFT program, which helped keep renters afloat following the end of ERAP. However, changes to the RAFT program in August 2022 required renters to provide a Notice to Quit as part of their application for rental assistance. Prior to this change, renters were able to access rental assistance funding without their landlords entering the eviction process – in other words before a Notice to Quit was issued in the first place. In practice, this means that renters must be facing more severe housing instability, beyond simply having rental arrears, in order to make renters eligible for assistance. Moreover, households making between 50% and 80% of the area median income (AMI) who were once eligible for rental assistance through ERAP were no longer eligible for RAFT, which limited funding to applicants below 50% AMI (or up to 60% AMI for households at risk of domestic violence).
These changes, coupled with the termination of other key rental assistance programs, has made navigating the eviction process significantly more challenging for tenants facing housing instability, evidenced by abnormally high rates of eviction filings over the last year.
Regional Trends:
Key Takeaways:
- Eviction filing rates vary greatly across the Commonwealth, with some communities experiencing disproportionate levels of housing instability.
- Central and Southeast Massachusetts down to Cape Cod have experienced disproportionately high rates of eviction filings.
- Gateway cities generally make up the majority of the top 10 cities in terms of eviction filing rates. Some notable non-Gateway cities that have appeared regularly on our top 10 tracking lists include Weymouth, Norwood, and Attleborough.
- Among large cities in Massachusetts, Boston and Springfield have significantly lower rates of eviction filings compared to the rest of the state.
Additional Context:
In our previous research, we found that Central and Southeast Massachusetts saw the highest regional rates of eviction filings since the beginning of the COVID emergency. According to the latest data, these regional trends have persisted, as Plymouth, Bristol, Barnstable, and Worcester Counties lead the state in filing rates. The map above shows regional eviction filing trends over the last six-month period of available filing data. Among larger cities and towns, our Gateway cities continue to experience heightened rates of eviction filings compared to the rest of the state.
Boston and Springfield are notable exceptions to the rest of the state, having significantly lower eviction filing rates compared to other large cities. Our previous research on evictions highlighted the high rates of rent relief disbursement per capita in these two cities, and though various key rental assistance programs have since stopped accepting applications, low rates of eviction filings have persisted in Boston and Springfield.
The chart on the right ranks cities with more than 5,000 renter households by their monthly eviction filing rates. Click through the filters on the top to explore which cities had the highest rates of eviction filings over the last six months of available data.
Eviction Filings vs. Eviction Executions:
Key Takeaways:
- Eviction filing rates for non-payment of rent have remained high since August 2022. As mentioned previously, non-payment eviction filing rates have increased by 86 percent in the last year.
- Over the course of the pandemic, eviction executions have been relatively low due in large part to the moratorium on eviction executions as well as large scale rent relief distribution.
- Executions have been steadily increasing over the last year, starting around the latter half of 2022. These trends may be tied to changes in rental assistance programs.
- RAFT, which is currently the main source of rental assistance funding, saw key changes in August of 2022, requiring a Notice to Quit as part of the standard application process. Since August 2022, both eviction filings and executions have noticeably increased.
- The latest month of available data, June ’23, had the highest number of eviction executions for non-payment since the beginning of the COVID emergency, nearly double the average rates over 2021 and 2022.
Additional Context:
Eviction filings only tell part of the story, particularly in the context of our state’s various eviction diversion efforts. Comparing filings to eviction executions tells us whether these eviction diversion initiatives are reaching renters in time to prevent them from losing their homes. An eviction execution is a legal authorization from a housing court that gives a landlord the right to remove a tenant from their home, including having police officers use force to evict a tenant and their belongings. Eviction cases, including eviction executions, remain on a tenant’s record, making it extremely difficult to find a new place to live.
Growing eviction execution rates coupled with abnormally high rates of eviction filings tell us that more and more tenants in Massachusetts are experiencing major housing instability. Additionally, there is likely several months of lag time between an eviction filing and an eviction execution due to the time spent in the court process, so it’s possible that this significant increase in eviction filings will result in even more eviction executions in the months to come. These trends tell us that there is even more unmet need and growing instability, particularly since many rent relief programs are no longer able to assist tenants in need, or at the prior level of assistance.
FORECLOSURE TRENDS
Key Takeaways:
- Petitions to foreclose have been steadily increasing since the end of the federal moratorium on foreclosures in June 2021.
- While trends show growing rates of monthly foreclosure petitions, these numbers remain lower than pre-pandemic monthly rates.
- March ’23 had the highest number of foreclosure petitions since the start of the pandemic (510 foreclosure petitions over the course of the month).
- Foreclosure deeds have remained low since the end of the moratorium on foreclosures and are significantly lower than pre-pandemic rates.
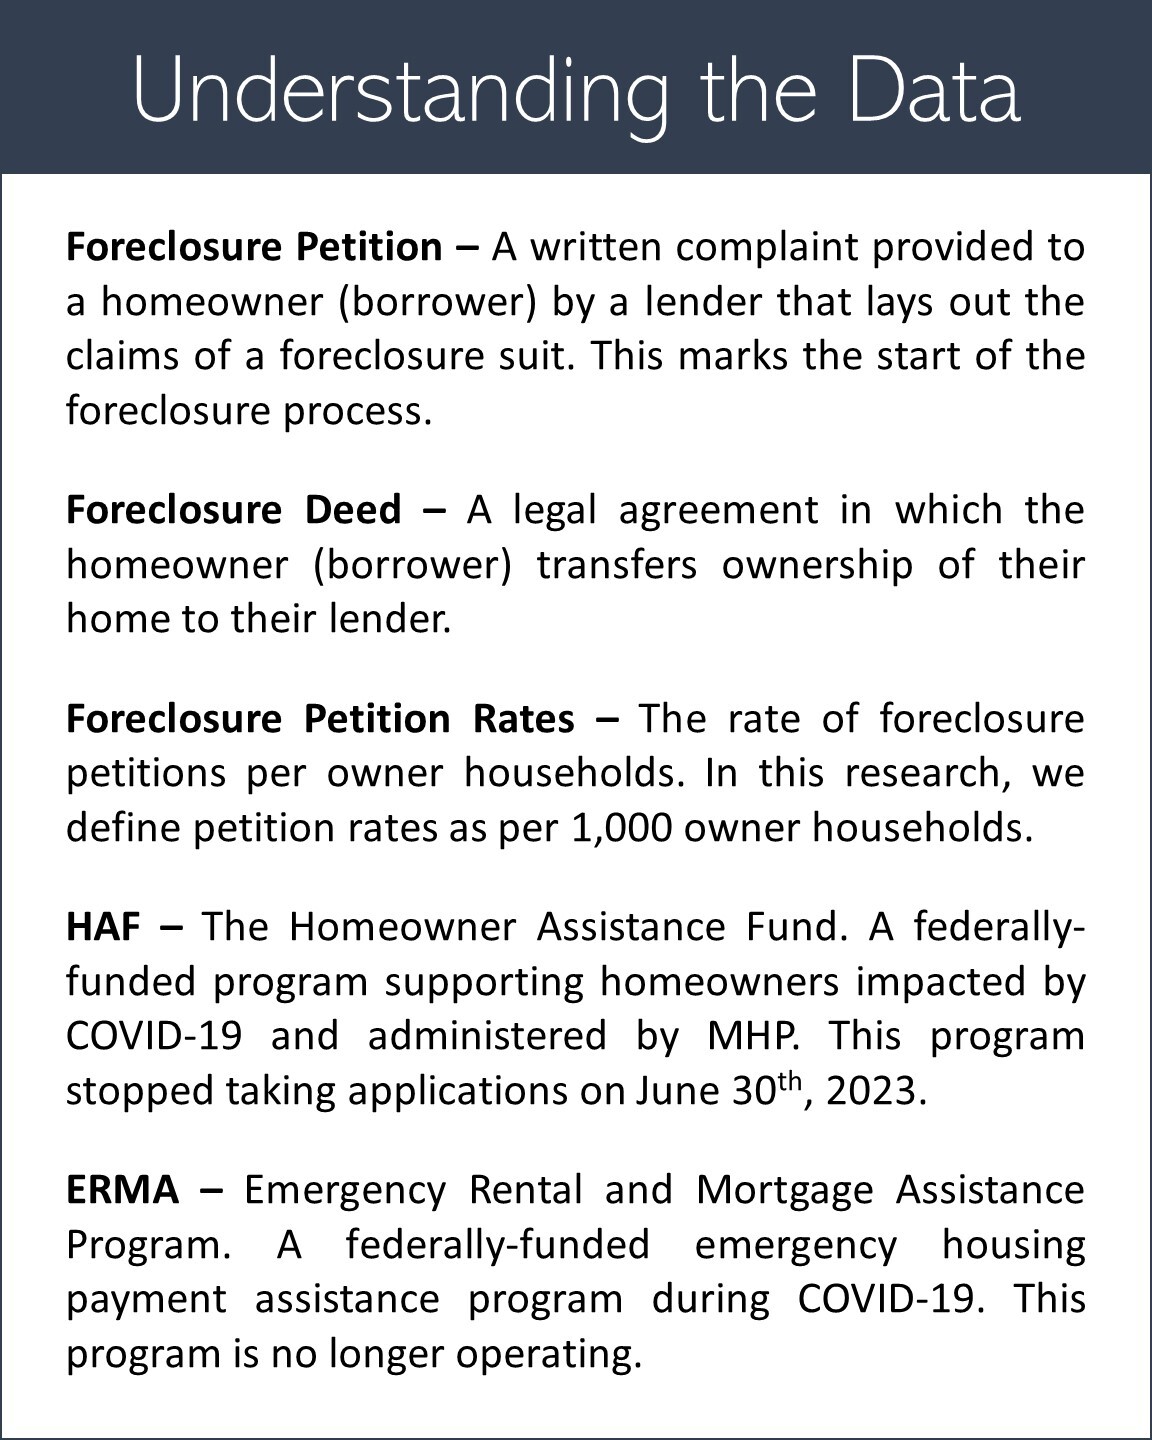
- Monthly foreclosure deed numbers appear stable, however with the end of various supportive programs such as ERMA and, most recently, the Homeowner Assistance Fund (HAF) program, foreclosure deed rates may begin to increase.
Additional Context:
Foreclosure petition and deed rates since the beginning of the pandemic have been greatly diminished compared to pre-pandemic trends, largely due to the impact of the federal moratorium on foreclosures. Post-moratorium, foreclosure trends remained relatively stable.
A comprehensive system of supportive programs helped prevent thousands of potential foreclosures. Programs such as the Emergency Rental and Mortgage Assistance (ERMA) program paid out $306 million to 34,358 households, before ultimately shutting down at the end of December 2021. The Massachusetts HAF program, administered by MHP and MassHousing, has supported over 7,600 households to date and is continuing to assist homeowners who applied to the program prior to the final application deadline on June 30, 2023.
Currently, homeowners in need of assistance can still apply for funding through RAFT, though these requests are limited to $7,000 or less (for reference, the average request for a HAF application was roughly $20,000). With the end of key supportive programs, coupled with growing rates of foreclosure petitions, we may see a change reflected in the number of monthly foreclosure deeds in the months to come.
Regional Trends:
Key Takeaways:
- Foreclosure petition rates vary across the state, though foreclosure petition rates are still relatively low across the board.
- Petition rates are somewhat regionally clustered. We observed higher rates in Central, Southeastern, and Western Massachusetts. These trends somewhat mirror eviction filing trends, though Western Massachusetts appears to have more activity on the foreclosure side.
- Smaller cities and towns in Central and Western Massachusetts overall have the highest rates of foreclosure petitions.
- Gateway cities are experiencing higher rates of foreclosure petitions, roughly mirroring eviction filing trends we observed in the Gateways.
- Springfield stands out with the highest rate of foreclosure filings among large cities. This is particularly notable since they had some of the lowest rates of eviction filings compared to other cities.
Additional Context:
The data suggests that middle and lower-income communities with greater numbers of homeowners have likely experienced greater impact. Communities in Central and Southeastern Massachusetts lead the state in foreclosure petition rates.
A few larger cities and towns stand out, particularly Springfield, Brockton, Randolph, and Gardner, with relatively high rates of petitions, though across all big cities, rates are low. This may be due in part to high interest rates and a less competitive housing market that may be influencing lenders to avoid initiating foreclosures and instead attempt to work out payment plans or encourage homeowners to apply for mortgage assistance.
These trends may change over the coming months as we see a consistent increase in foreclosure petition rates that may reveal clearer regional disparities. A searchable and filterable town by town breakdown is available below.
For questions related to eviction and foreclosure data in your community, or additional information about this brief, please contact Matija Jankovic.
Eviction filing data is provided by MassLandlords Inc. and is available online at: https://masslandlords.net/policy/eviction-data/
Foreclosure data is provided by The Warren Group.